Building a compound interest calculator using React and Chart.js
React
After building a to-do list app with React (here is an article I wrote about it), I was eager to keep building and learning new things. Over the years I've tinkered quite a few times with some of the compound interest calculators you can find online, so I thought building my own version would be a cool project to work on.
How it works
The tool is pretty straightforward: you just have to enter your current investment capital, the contribution amount, the contribution frequency (you can choose between monthly or annually), the investment duration (in years), the interest rate and the compound frequency (again, you can choose between monthly or annually) to get the future value of your investment.
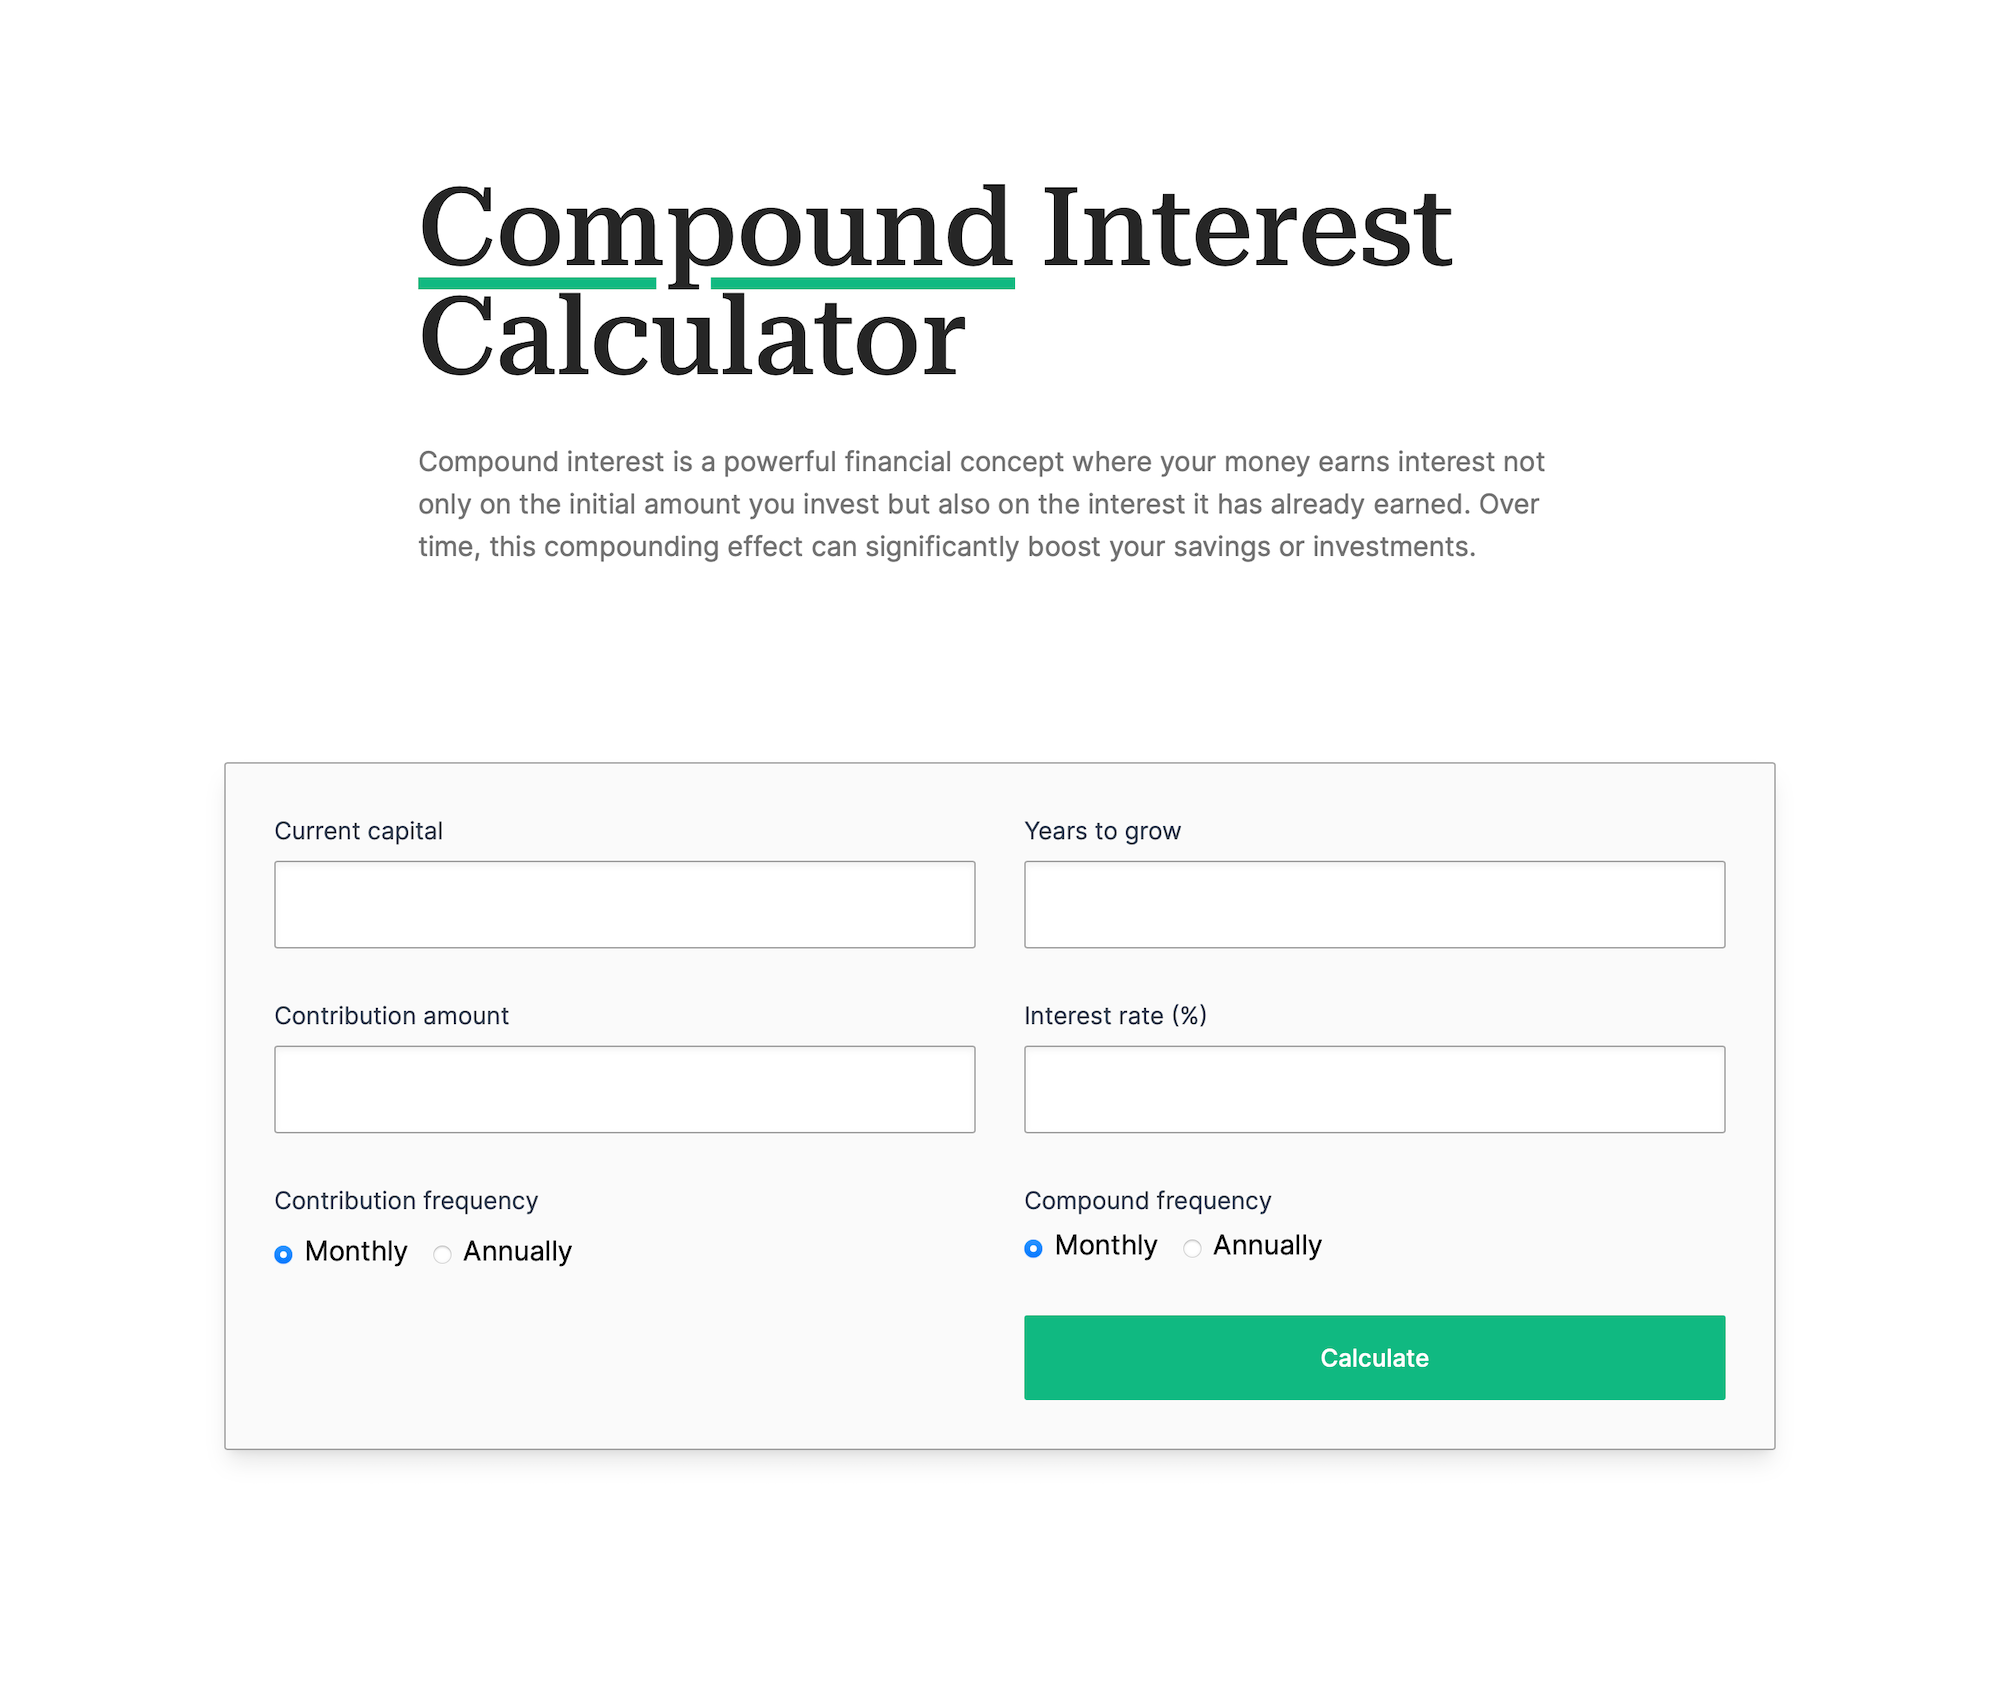
I also added a Calculate button you can click to get the future value of your investment. Once you click that button, the website will scroll to the chart section. A cool thing I like is that you can update the numbers as you want and both the future value and the chart will keep updating even if you don't click the Calculate button anymore.
Building the chart
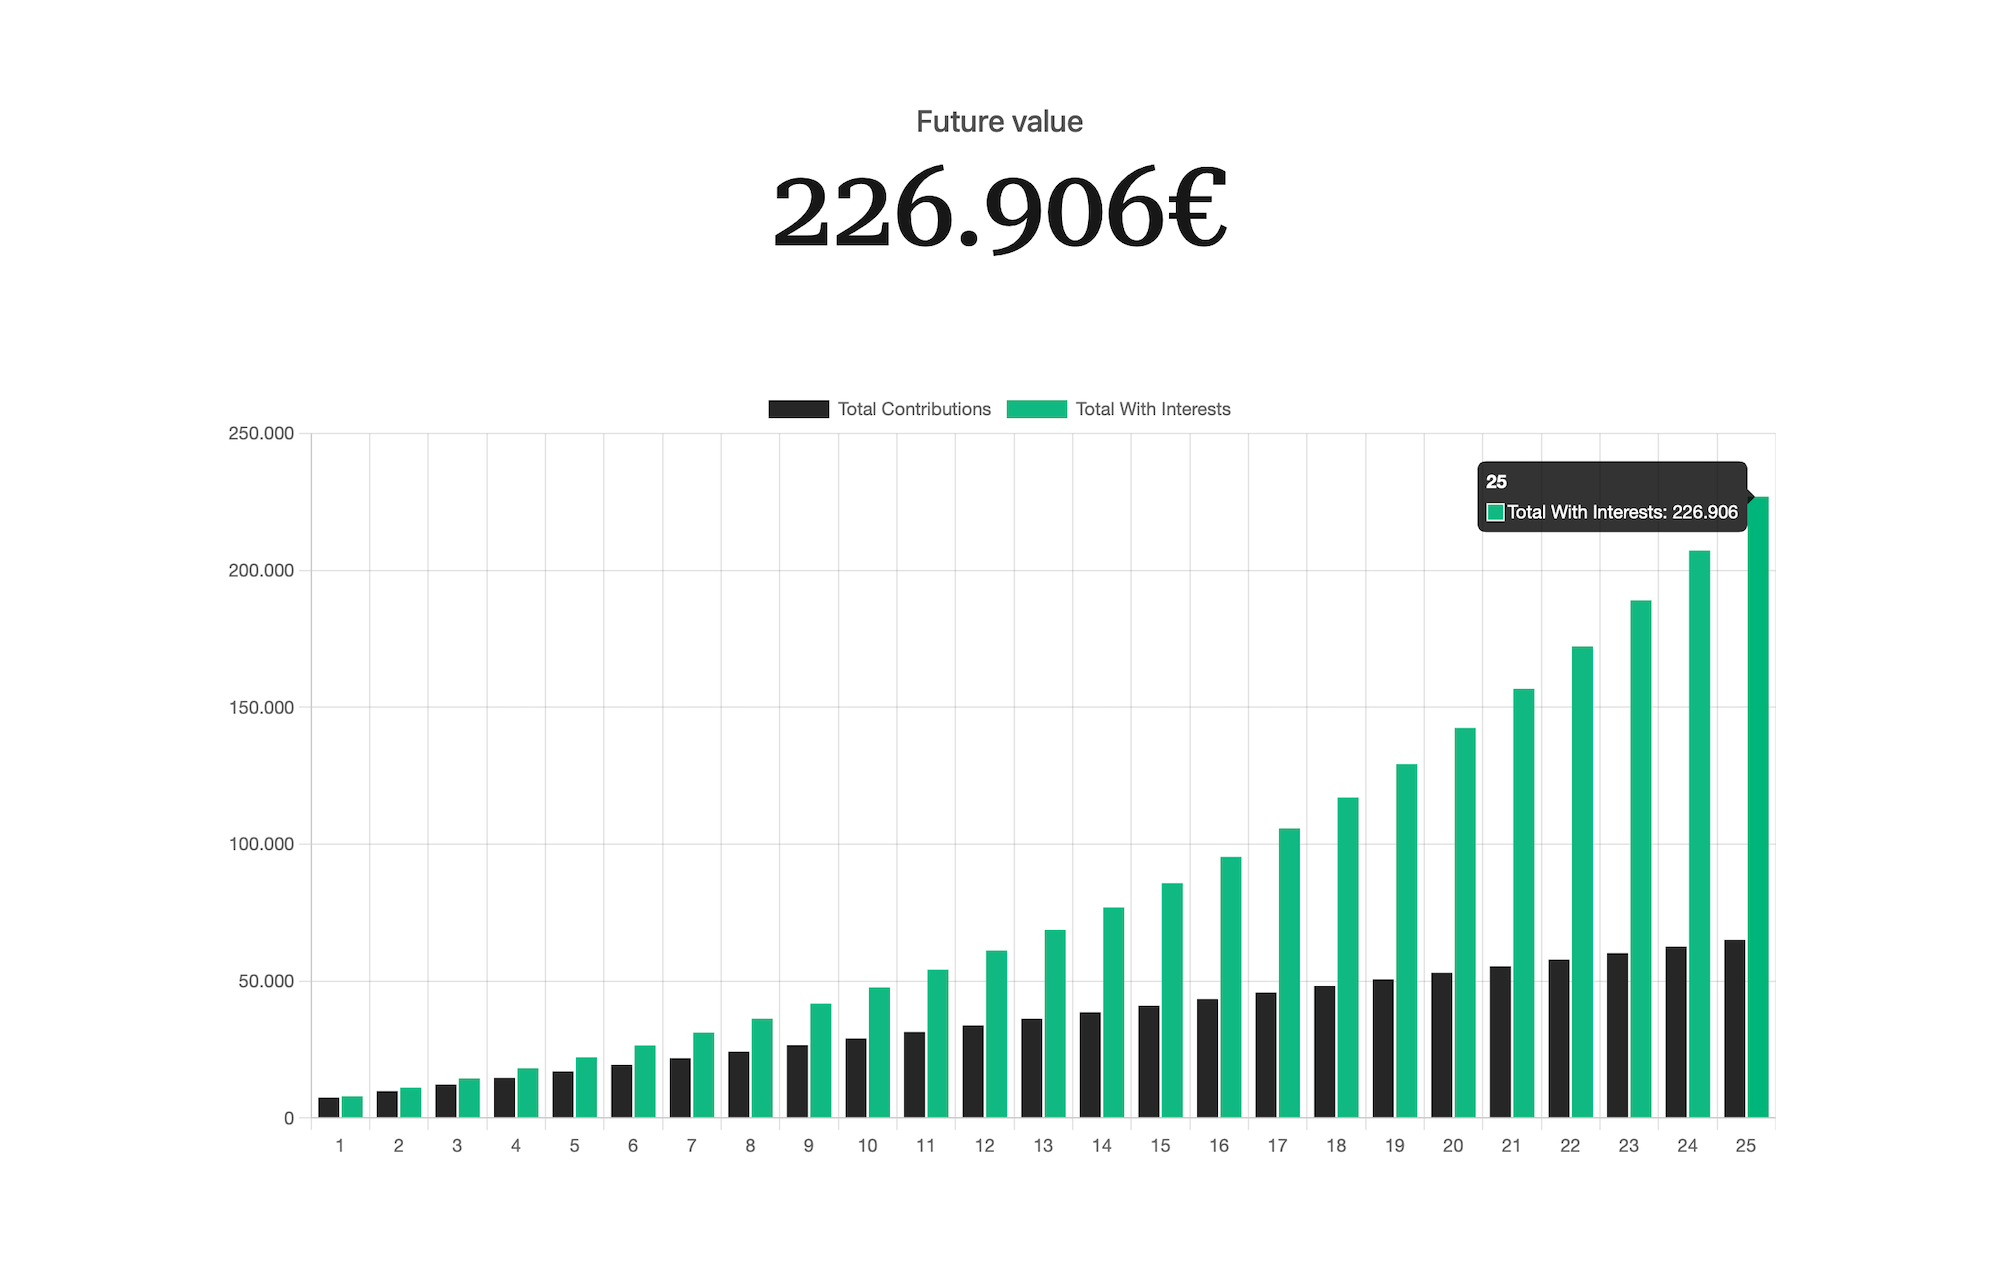
Before I started working on this project I had no idea how to make charts using code. After some research I came across Chart.js, a JavaScript charting library that seemed a pretty good fit for the kind of chart I needed. As you can see in the picture below, I'm using a bar chart with two different data sets: total contributions and total with interests. Thanks to the magic of Chart.js you can interact with the graph: if you hover (or tap) over the bars you will see the data for the desired year.
Learnings
I had a lot of fun while working on this project. I learnt about making charts with code and I kept practising with the useEffect React Hook I also used in my previous app (that is how the chart gets updated every time you change a value). I also learnt how to implement math formulas on code and how to format numbers (you'll notice I'm not showing decimals on the future value result).